
Table of contents
- Main points
- Statistician’s comment
- Things you need to know about this release
- Your views matter
- UK gross domestic expenditure on R&D performed in the UK, 2015
- Expenditure on R&D performed in the UK, by sector of performance
- R&D expenditure by funding sector
- UK defence R&D expenditure
- Country and regional breakdown of UK R&D expenditure
- International comparisons of GERD as a percentage of GDP (R&D intensity)
- Links to related statistics
- Quality and methodology
1. Main points
- Research and development (R&D) continued to grow, expanding by £1.2 billion to £31.6 billion in 2015, an increase of 4%.
- Most of this year’s growth came from the business sector, which increased by £1.1 billion to £20.9 billion, an increase of 5%.
- R&D over the long-term has grown, rising from £20.1 billion in 1990 (in constant prices, adjusted to remove the effects of inflation) to £31.6 billion in 2015, an increase of 58%.
- Total R&D expenditure in the UK in 2015 represented 1.68% of gross domestic product (GDP), an increase from 1.66% in 2014; this was below the European Union (EU-28) provisional estimate of 2.03% of GDP, but the 11th highest of all member countries.
2. Statistician’s comment
“The UK spent £206 per head of population on performing R&D in 1990. This has increased by 136% to £486 in 2015. Removing the effects of inflation this represents an increase of 39%.”
Daniel Groves, National Accounts and Economic Statistics, Office for National Statistics.
Back to table of contents3. Things you need to know about this release
This release provides estimates of R&D performed in and funded by the following 4 sectors of the UK economy, as defined in the “Frascati” Manual (2015):
- business enterprise (BERD)
- higher education (HERD)
- government, which includes research councils (GovERD)
- private non-profit organisations (PNP)
These sectors’ R&D data are known collectively as gross domestic expenditure on R&D (GERD). GERD is the preferred measure of R&D activity for use in international comparisons. This release reports on R&D expenditure in the UK irrespective of the country of residence of the ultimate owner or users of the R&D produced.
R&D is measured by the expenditure on R&D performed by an organisation, or the funding received by an organisation for R&D work. These are often but not always the same. R&D performed is regarded as a more accurate measure than funding received by an organisation, as not all funds received may be used on R&D as intended.
The business sector is the largest component of GERD; its estimates in this release are derived from the Business Enterprise Research and Development 2015 statistical bulletin, published on 17 November 2016.
Back to table of contents4. Your views matter
We are constantly aiming to improve this release and its associated commentary. We would welcome any feedback you might have, and be particularly interested in knowing how you make use of these data to inform your work. Please contact us via email: RandD@ons.gov.uk or telephone Cecil Prescott on +44 (0) 1633 456767.
Back to table of contents5. UK gross domestic expenditure on R&D performed in the UK, 2015
Expenditure on R&D performed in the UK was £31.6 billion in 2015, reaching its highest level on record. This was up from £30.4 billion in 2014, an increase of 4%. The average annual growth rate since 1990 was also 4%.
In constant prices (adjusted to remove the effects of inflation), the 2015 estimate surpassed 2014’s high by £1.0 billion, with growth of 3%. With an average annual growth rate of 1.8% since the 1990 level of £20.1 billion, the long-term upward trend, in constant prices, is still evident.
Total expenditure on R&D in 2015 represented 1.68% of GDP, an increase from 1.66% in 2014. As a percentage of GDP, this expenditure declined steadily between 1990 and 1997. Since then, the level has fluctuated between 1.53% and 1.68% with an average estimate of 1.62% for the period 1998 to 2015.
Back to table of contents6. Expenditure on R&D performed in the UK, by sector of performance
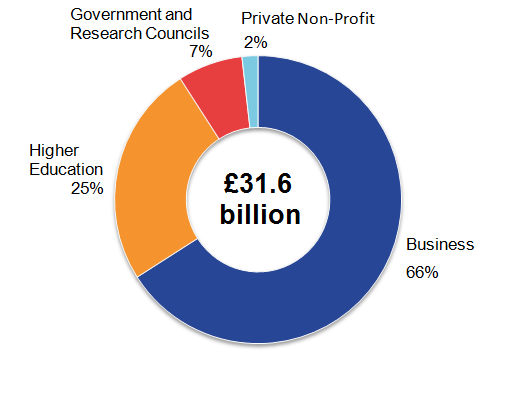
UK estimates of R&D cover the 4 sectors of the economy, namely business, higher education, government (including research councils) and private non-profit organisations. Figure 1 shows the contribution each sector made to the total UK R&D expenditure estimate in 2015.
Figure 1: Composition of UK gross domestic expenditure on research and development by performing sector, 2015
Source: Office for National Statistics
Download this image Figure 1: Composition of UK gross domestic expenditure on research and development by performing sector, 2015
.png (23.8 kB) .xls (26.6 kB)
Business
The business sector performs the most R&D in the UK. In 2015, it accounted for £20.9 billion of expenditure, representing 66% of total expenditure on R&D performed in the UK. This is growth of 5% from £19.8 billion in 2014.
On an annual basis, the 400 largest business R&D performers are asked to select the industry product groups that best describe the type of R&D they undertake. For the smaller R&D performers, no product group data are collected, however, these businesses’ dominant Standard Industrial Classification (SIC) is used as a proxy to determine product group. The concept of "product groups" is described in more detail in the UK Business Enterprise Research and Development Quality and Methodology Information (QMI).
The product groups with the largest R&D expenditure in 2015 were:
- pharmaceuticals (£4.2 billion)
- motor vehicles and parts (£2.7 billion)
- computer programming and information service activities (£2.4 billion)
- aerospace (£1.7 billion)
- miscellaneous business activities (£1.1 billion)
- machinery and equipment (£1.0 billion)
The UK government has continued to promote growth in R&D, particularly in the business sector, through tax relief and Catapult Centres. A Catapult Centre is a “technology and innovation centre where UK businesses, scientists and engineers can work together on research and development, transforming ideas into new products and services”.
More detailed information on business R&D expenditure can be found in the Business Enterprise Research and Development 2015 statistical bulletin published on 17 November 2016.
Higher education
The higher education sector, which includes universities and higher education institutes, was the second largest sector, accounting for 25% of total UK R&D expenditure in 2015, at £8.0 billion. This is growth of 2% from £7.8 billion in 2014.
Please note that new financial reporting standards for reporting periods starting on or after 1 January 2015 have introduced significant changes in the way financial performance is reported, which present difficulties in comparing 2015 results with historical trends. The funding for this sector is mainly provided by the Higher Education Funding Councils for England, Scotland, Wales, the Department for Employment and Learning in Northern Ireland and the 7 UK research councils.
Government and research councils
The UK government owns many research institutes and laboratories that carry out R&D. These are managed by various government departments, including the Department for Business, Energy and Industrial Strategy, the Department for Environment, Food and Rural Affairs and the Department of Health.
In 2015, R&D expenditure in the UK performed by the government and research councils sector decreased by 5% from £2.2 billion in 2014 to £2.1 billion. This sector accounted for 7% of total expenditure on R&D performed in the UK in 2015.
Research Councils UK (RCUK) is the strategic partnership of the UK's 7 research councils. Each year the councils perform research covering the full spectrum of academic disciplines from the medical and biological sciences to the arts and humanities. RCUK also offers individuals and businesses overseas, access to the UK’s research facilities and infrastructure.
Research councils’ R&D expenditure decreased by 6% from £819 million in 2014 to £773 million in 2015.
Private non-profit organisations
The private non-profit (PNP) sector includes registered charities and trusts. Those performing R&D specialise in mainly health and medical research. Some of the largest of these are based in the UK. This sector includes, for example, a number of cancer charities that carry out extensive research, from cancer prevention to drug development and clinical trials.
The PNP sector is the smallest R&D performing sector in the UK. In 2015, expenditure on R&D performed by these organisations was £0.6 billion, which contributed 2% to total UK-performed R&D expenditure. However, this sector did see the largest overall increase in percentage terms, up 15% from 2014. This is mainly attributable to the addition of several organisations, set up specifically to carry out large R&D projects. It should also be noted that the PNP survey is biennial and therefore the 2014 results were estimated.
Back to table of contents7. R&D expenditure by funding sector
In 2015, the largest funder of R&D performed in the UK was the business sector, which funded 49% or £15.5 billion, of total UK-performed R&D. This was an increase of 9% from £14.2 billion in 2014.
Government (including research councils) was the second largest sector of funding with £6.5 billion, which was 21% of total UK R&D funding in 2015. This was a decrease of 1% from £6.6 billion in 2014. In comparison the sector itself only spent £2.1 billion in 2015 performing R&D in the UK.
In just over 2 decades, there has been a change in the profile of how UK R&D expenditure has been funded. In 1990, R&D funding from overseas was £2.4 billion (12%) in constant prices. Since then, there has been a steady increase in the value of funding from overseas to £5.4 billion (17%) in 2015. Funding of R&D from overseas decreased by 3% since 2014, the first decrease since 2012, while the average annual growth rate since 1990 was 3.3%.
Figure 2 shows the breakdown of UK GERD by funding sector for the last 2 decades.
Figure 2: Composition of UK gross domestic expenditure on research and development by funding sector in constant prices, 1995 to 2015
Source: Office for National Statistics
Download this chart Figure 2: Composition of UK gross domestic expenditure on research and development by funding sector in constant prices, 1995 to 2015
Image .csv .xlsIt is important to note that sectors can fund themselves. For example, in 2015, the business sector performed £20.9 billion, of which £15.1 billion was funded by the business sector itself. The remaining £5.8 billion of R&D expenditure performed by businesses was funded by other sectors and overseas.
Back to table of contents8. UK defence R&D expenditure
R&D expenditure in the UK for defence purposes accounted for 5% of total R&D expenditure (£1.7 billion) in 2015. This represented a decrease of 2% from 2014. In constant prices, defence R&D expenditure has decreased by 62% since the 1990 estimate of £4.5 billion.
The business sector was by far the largest performer of both civil and defence R&D in 2015, at £19.4 billion (65%) and £1.5 billion (87%) respectively.
The UK government’s funding of defence R&D in 2015 was unchanged from 2014 at £1.2 billion. The proportion of UK total defence funding by the government sector also remained unchanged from 68% in 2014. The business sector provided £0.4 billion (23%) of funding and £0.2 billion (9%) came from overseas.
Of particular note, business R&D expenditure in the civil sector grew by 81% in constant prices since 1990, but business expenditure on R&D in the defence sector decreased by 50% over the same period.
Back to table of contents9. Country and regional breakdown of UK R&D expenditure
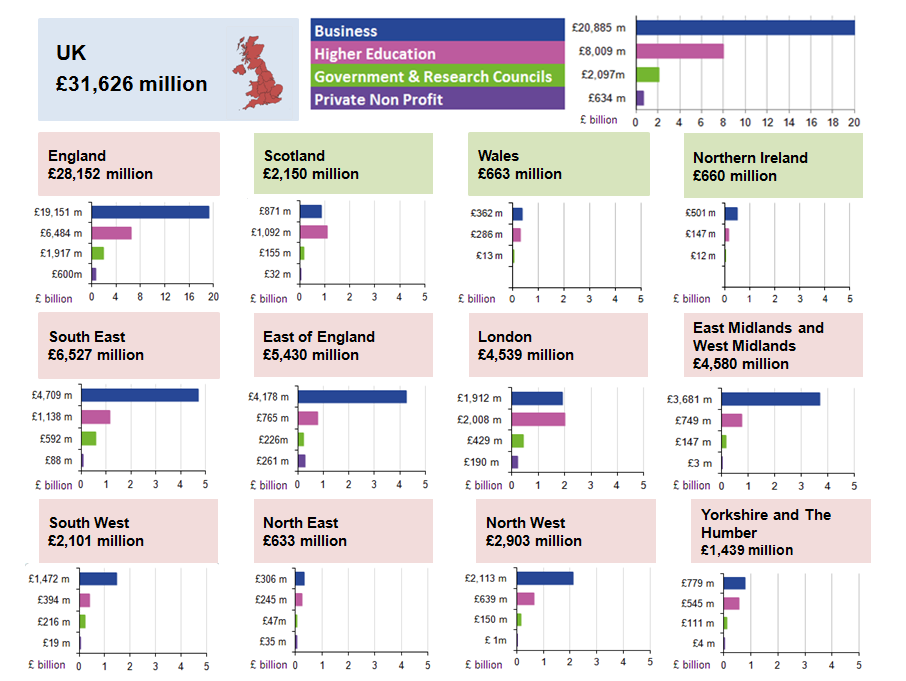
R&D expenditure can be analysed by UK country and region (Figure 3). In this context, the country and region refers to the location where the R&D is performed.
In 2015, the South East and East of England dominated R&D activity in the UK. These regions together accounted for 38% of total UK R&D expenditure (£12.0 billion).
The majority of UK R&D expenditure was carried out in England (£28.2 billion) in 2015. Scotland accounted for £2.2 billion (7%), with Wales and Northern Ireland both contributing £0.7 billion (2%) each.
The methodology for producing regional estimates of expenditure on R&D for the government (including research councils) sector has been reviewed. Estimates previously used departments’ full-time equivalent (FTE) R&D employees by region as a proxy to calculate regional expenditure. Departments now provide actual breakdowns of their R&D expenditure by region. To allow comparison of the government data, values using both methods have been included in Table 6 of the datasets accompanying this bulletin. Due to this change in methodology it has not been possible to compare regions on a like for like basis.
The business sector remained dominant throughout the majority of the UK. However, the higher education sector continued the trend of dominating London and Scotland with spends of £2.0 billion and £1.1 billion respectively. This pattern has been evident for some time. In 2015, the gap between higher education and business in London continued to reduce whereas the gap in Scotland has increased slightly. However, while higher education dominated London and Scotland, this sector’s largest annual average increase since 2001 was in the South West at 5.6% compared with Scotland at 5.4% and London at 5.1%.
Figure 3: UK gross domestic expenditure on research and development by sector, country and region, 2015
Source: Office for National Statistics
Notes:
- East Midlands and West Midlands regions data have been combined due to confidentiality.
- - denotes nil, figures unavailable or too small to display.
- Please Note: Differences may occur between totals and the sum of their independently rounded components.
Download this image Figure 3: UK gross domestic expenditure on research and development by sector, country and region, 2015
.png (126.5 kB) .xls (33.8 kB)
10. International comparisons of GERD as a percentage of GDP (R&D intensity)
Europe 2020 targets specify 5 targets for the European Union (EU) to achieve by 2020, including a target of 3% of the EU’s gross domestic product (GDP) to be invested in R&D. Therefore, the estimates in this release are used in monitoring progress towards this target.
The latest Preliminary estimates produced by Eurostat indicate the percentage of R&D to GDP increased marginally in the EU-28 up to 2003, reaching a high of 1.79%, before declining slightly through to 2005 (1.74%) and then climbing again to an estimated 2.03% in 2015 (Figure 4). Please note that the 2015 results for the EU-28 and Organisation for Economic Co-operation and Development (OECD) countries are early estimates and are provisional at the time of this release.
Figure 4: GERD to GDP ratio as a percentage (R&D intensity) by country, European Union (EU-28), 2015

Source: Eurostat
Download this image Figure 4: GERD to GDP ratio as a percentage (R&D intensity) by country, European Union (EU-28), 2015
.png (277.1 kB) .png (277.1 kB)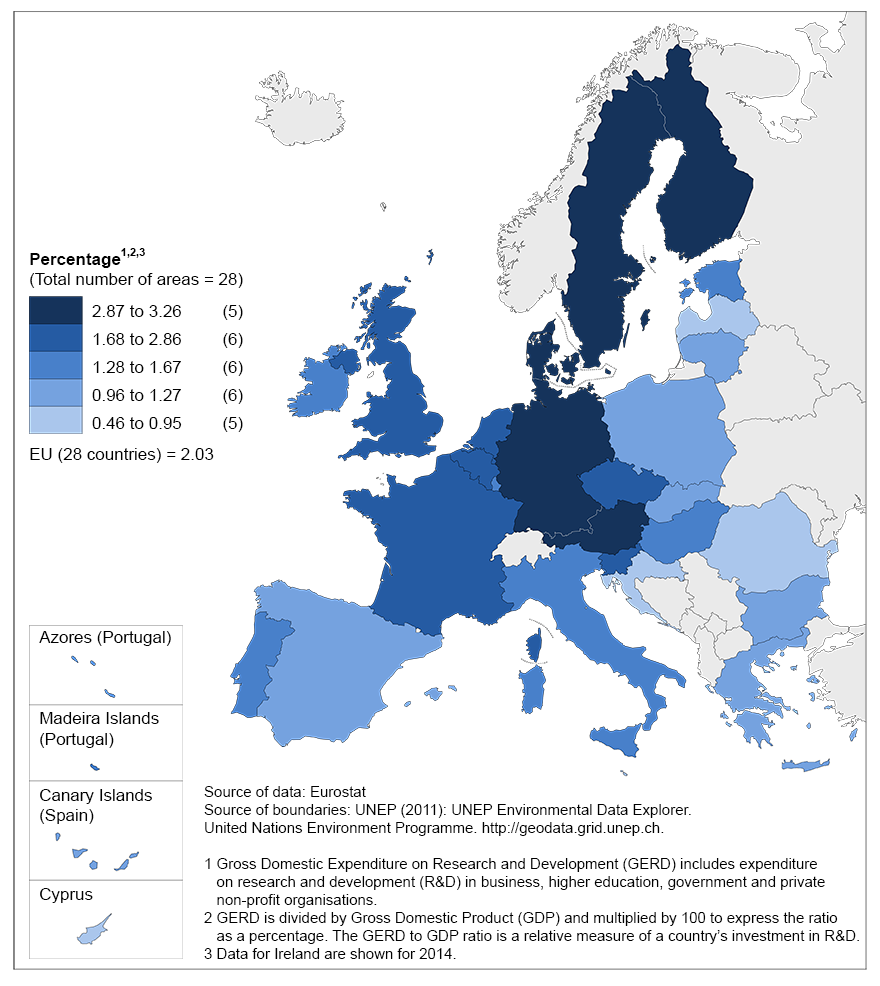
Figure 5 shows the latest available 2015 estimates as a means of placing the UK into an international context with regards to gross domestic expenditure on R&D (GERD) as a percentage of GDP. It shows the individual EU-28 countries’ GERD as a percentage of GDP, as well as the average for the EU-28, compared with the Europe 2020 target of 3%. The UK’s GERD represented 1.68% of GDP in 2015, an increase from 1.66% in 2014. The UK remained unchanged as the 11th highest GERD as a percentage of GDP of all EU-28 countries, where the average was 2.03% of GDP.
Figure 5: EU countries' gross domestic expenditure on research and development as a percentage of gross domestic product (R&D intensity), 2015
Source: Eurostat
Notes:
- Some EU countries' 2015 estimates taken from the Eurostat website are provisional.
- * = data for 2014.
Download this chart Figure 5: EU countries' gross domestic expenditure on research and development as a percentage of gross domestic product (R&D intensity), 2015
Image .csv .xlsWhen comparing total R&D intensity across countries, it is important to take into account differences in individual countries’ economic structures. The OECD has produced a Science, Technology and Industry Scoreboard to facilitate these comparisons.
Back to table of contents12. Quality and methodology
The UK gross domestic expenditure on research and development Quality and Methodology Information document contains important information on:
- the strengths and limitations of the data and how they compare with related data
- users and uses of the data
- how the output was created
- the quality of the output including the accuracy of the data
About the data
These points should be noted when examining this bulletin or the data tables:
- there may be differences between totals and the sum of their independently rounded components
- in some tables, entries have either been aggregated or suppressed to avoid disclosure of figures in which the returns of individual organisations could be identified – where this happens, footnotes have been added to the tables
- note that £1.0 billion equals £1,000 million in this release
- the majority of the data series started in 1989 and constant price comparisons have been made using the start of the next decade in 1990
- the 2013 and 2014 estimates have been revised where necessary to take account of businesses misreporting and late returns
- all figures quoted are in current prices unless otherwise stated
Notes
A definition of “R&D” can be found in the Frascati Manual (2015). This is the internationally agreed standard as defined by the Organisation for Economic Cooperation and Development (OECD).
The GDP measure used is non-seasonally adjusted money GDP between 1955 to 1956 and 2014 to 2015 (1955 to 2015) consistent with UK Economic Accounts Quarter 3 2015 published on 23 December 2016.
This release now includes data tables (LF1 and LF2) on qualified scientists and engineers in the labour force by gender. These estimates are from our Labour Force Survey and are categorised by type of qualification and occupation from the population of Great Britain aged 16 to 64. Occupation is based on the Standard Occupational Classification 2010 (SOC2010). This information was previously published in the "UK government expenditure on science, engineering and technology". However, these data are more relevant in the context of GERD R&D and can be made accessible at an earlier date.
Coherence and international comparisons
An information note providing an assessment of the coherence of R&D statistics with other official statistics was published in 2012 on our website.
Back to table of contents